eCommerce Agency Guide to Conversion Rate

Article topics
- What is Conversion Rate?
- Conversion Funnel
- The Conversion Rate Metric
- eCommerce conversion Rates by Industry
- eCommerce conversion Rate by Device
- Omnichannel conversion rates
- eCommerce Conversion Tips
- Final thought
A diligent and well implemented conversion rate optimisation strategy increases eCommerce sales and customer retention.
What is Conversion Rate?
A conversion is when a consumer takes a desired action when browsing on your eCommerce website, such as clicking a CTA, watching a video, subscribing to your newsletter or adding an item to the shopping cart. It’s any action that progresses consumers along the path to purchase, with the ultimate conversion being the completion of checkout and a purchase made.
Conversion rate is the percentage of consumers who visit your webstore who convert compared to the total number of visitors. It offers insights into how well your webstore is performing in terms of user experience (UX) and how effective your marketing efforts have been.
A higher conversion rate indicates that marketing and UX are working well and that you are targeting the right consumers with the right product and offering lower friction, more engaging shopping journeys.
Conversion Funnel
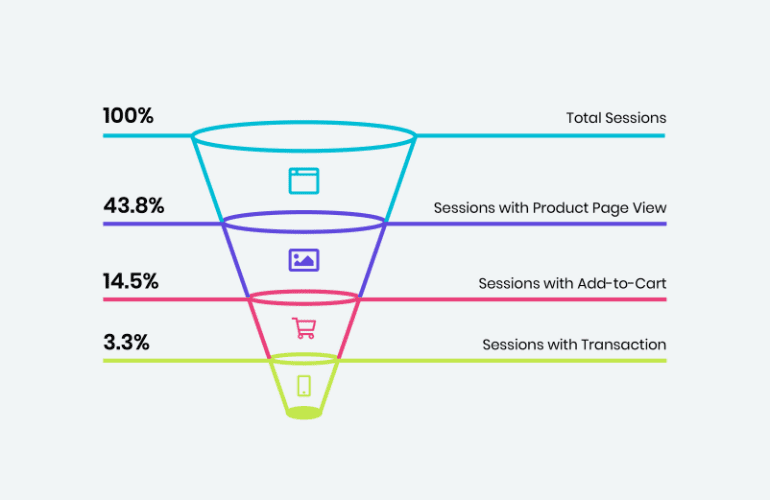
As consumers progress along their shopping journeys on your eCommerce website they begin to fall away. This happens form many different reasons. Conversion rate optimisation seeks to find out what these reasons are (poor UX, pain points, slow page load, lack of trust etc.) and correct them. The conversion rate funnel shows how and where consumers are most likely to click away from your webstore:

The Conversion Rate Metric
The calculation, or metric, used to measure conversion is simply:
Conversion rate = number of webstore visitors / total number of sales
For example, if you had 50 conversions from 1,000 interactions, your conversion rate would be 5%:
50 ÷ 1000 = 5%
So, what is a good conversion rate? There is no simple answer to this question. It varies from industry to industry. There are also other factors that influence conversion rates such as device (mobile, tablet or PC), location, product cost, traffic source etc. Specialist eCommerce agencies use conversion rate optimisation (CRO) techniques to understand how consumers navigate and engage with your webstore, with the goal of increasing the percentage of consumers who convert, not just at checkout, but at every stage of their shopping journey.
eCommerce conversion Rates by Industry
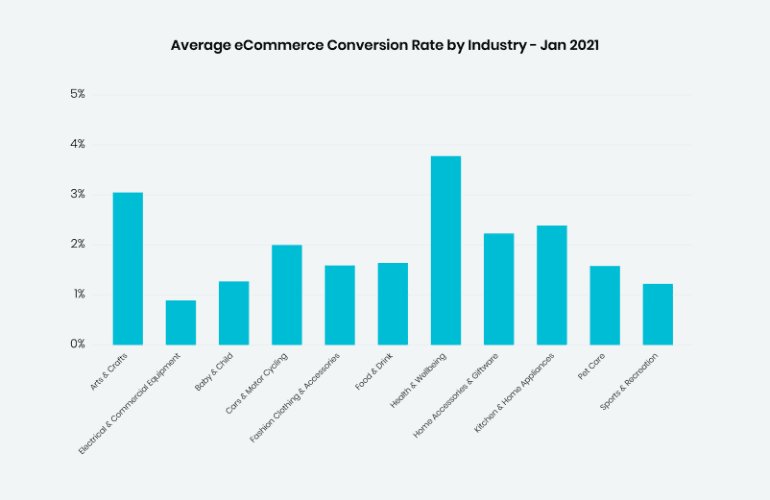
Different industries have different average conversion rates. For example, in January 2021 the average conversion rate for the health & wellbeing sector was 3.78%, compared with 0.89% for baby & child. You will be able to benchmark the average conversion rate for your industry.

Be cautious when making comparisons with competitors. For example, a fashion brand targeting younger people will likely have a difference in its overall conversion rate when compared to a fashion retailer catering for a more mature or niche market. So with competitor conversion rate analysis, make sure you compare like for like.
Assuming your ecommerce website’s conversion rate is in the ballpark of your industry average then that’s a good foundation on which to build. From then on, any conversion rate that is an improvement on the last is great.
eCommerce conversion Rate by Device
With consumers using smartphones and tablets more to shop, it’s important to know which conversion rate benchmarks you should be getting with which devices. Mobile devices have overtaken desktop for online shopping, but the data shows that conversion rate for mobile is actually lower.
| Q3 2019 | Q4 2019 | Q1 2020 | Q2 2020 | Q3 2020 | ||
|---|---|---|---|---|---|---|
| Global | Desktop | 3.48% | 3.65% | 2.55% | 2.38% | 2.59% |
| Global | Mobile Phone | 1.79% | 2.06% | 1.84% | 2.12% | 1.86% |
| Global | Other | 0.21% | 0.18% | 0.12% | 0.14% | 0.97% |
| Global | Tablet | 3.56% | 3.72% | 2.43% | 2.10% | 2.51% |
| US | Desktop | 3.56% | 3.72% | 2.43% | 2.10% | 2.51% |
| US | Mobile Phone | 1.51% | 1.85% | 1.61% | 2.01% | 1.68% |
| US | Other | 0.25% | 0.34% | 0.19% | 0.21% | 0.26% |
| US | Tablet | 3.48% | 3.80% | 3.12% | 3.32% | 3.20% |
| GB | Desktop | 5.01% | 5.11% | 4.14% | 5.30% | 5.74% |
| GB | Mobile Phone | 3.47% | 3.44% | 3.15% | 2.97% | 2.90% |
| GB | Other | 1.33% | 1.09% | 0.40% | 0.34% | 13.63% |
| GB | Tablet | 4.53% | 4.23% | 3.64% | 4.22% | 4.41% |
While in the UK desktop and tablet conversion rates are comparable, globally the average order value on a desktop was 42% higher than on a mobile phone in Q3 2020.
Omnichannel conversion rates
Conversion rate benchmarks are traditionally calculated using online purchases. However, in recent years, as omnichannel shopping has become more prevalent, consumer shopping journeys are increasingly mixing online with offline.
Consumers are researching products online, perhaps demoing them in-store, and then making a purchase from a seller that’s offering the best deal in terms of price and value, whether that’s online or in-store.
Research by Google and Wolfgang Digital shines a light on research-online purchase-in-store consumer behaviour.
eCommerce Conversion Tips
Understanding what constitutes a good conversion rate for your eCommerce business gives you a starting point to begin a CRO strategy. Using conversion rate as a KPI will enable you to gauge whether or not your CRO efforts are successful.
CRO, although important, should be part of your business’s overall KPI tool kit, and for the best results your conversion rate optimisation strategy should be developed in partnership with an expert CRO eCommerce agency.
The CRO process is a cycle of adjustment and streamlining of webstore elements to make them more user-friendly and to encourage browsing consumers to convert into customers. These elements include website performance, page layout design, using more intuitive user interfaces and building audience trust.
Mobile friendly
As omnichannel shopping becomes more common and the line between eCommerce and shopping in a brick-and-mortar store diminishes, optimising for mobile is becoming more important.
Your online store should render well on any device, so ensuring that it’s dynamic will give consumers more satisfying shopping experiences. For best mobile performance using a native app or a progressive web app (PWA) approach can improve UX.
Ensure that you take mobile conversion rate separately to desktop conversions so that you can measure how each is performing in its own right to identify where improvements might be made.

Page Load Speed
One of the main causes of consumers clicking away from browsing webstores is slow page load speed. To click and then have to wait for a page to fully load is frustrating and these days, with faster internet connections and higher performance webstores, consumers simply expect pages to load very quickly.
47% of online shoppers expect web pages to load in two seconds or less.
Streamline User Experience
Pages cluttered with too much information increases cognitive load, making it more difficult to focus consumer attention on the actions that you want them to take. Each page element should be set in its own space, with attention-grabbing font styles and sizes, and appropriate colour design, to better guide consumer engagement.
The bottom line with eCommerce page design and layout for increased conversion rates is to be intuitive to use. Don’t trip consumers up or make them work harder than is necessary when navigating your eCommerce website.
Clear Signposting
Remember, shopping journeys are just that, journeys. And to complete a journey as fast and as satisfyingly as possible requires clear signposting. Guiding consumers as they browse will help them find the products and information that they want.
The design, colour, style and size of a call-to-action (CTA) button will affect its performance. Where CTAs are positioned on a page also impacts how effective they are—if a CTA appears too early on a page, consumers might not be ready to act; if too low down the page, it might be missed.
Consumers prefer to learn about an offer before clicking a CTA—studies have shown that placing a CTA above the fold decreased conversions by 17%.
Simplify Checkout
One of the biggest causes of cart abandonment is long forms. Checkout is not the place to gather customer marketing data. All you need is customer name, billing address, delivery address (if different), email address and payment details. For new customers, offering a guest checkout option so that they don’t have to create an account will reduce friction and help boost conversion.
Remember, you can use marketing emails and messaging post purchase to develop customer relationships and glean information that will enable you to offer more personalised and valuable shopping experiences.
Use Social Proof
Social proof is an effective way to build consumer trust. Being able to see first-hand accounts of how much your customers like your products and customer service, consumers will be more likely to feel comfortable shopping in your webstore.
Positive reviews are an effective way to communicate to new consumers that you’re a trustworthy brand and business. Including reviews and star ratings on your product pages will help instil trust and a sense of authenticity.
The best way to get reviews from your customers is to simply ask for them. Ask customers to leave feedback about your products and their experiences on review websites such as Trust Pilot or Google Reviews, and then leverage those reviews as marketing collateral. Remember, word of mouth is often how good reputations are built.
81% of consumers trust the advice of friends and family over businesses.
CRO Testing
CRO must be approached scientifically. Each test, just like a scientific experiment, should begin with a hypothesis that is then either proven or disproven—no guesswork allowed—using tools such as heat maps, session recording and A/B testing. Only by the diligent and ongoing application of these techniques will you begin to see positive results.
The way to understand which of your CRO tactics are working, and which are not, is by testing them and comparing them with similar tests. A/B testing can produce surprising results that challenge expectations about webstore content and UX.
An example of a simple adjustment having a powerful impact on conversion was demonstrated by Vanity Planet, an eCommerce beauty retailer. They added images of delighted customers to the product page of a particular skin brush and then A/B tested the variation against the original page.
Over 10 days, Vanity Planet tested 6000 unique visitors. The conversion rate for the original page was 6.56%. For the new page it was 8.11%. Optimising in this way gave Vanity Planet a conversion rate lift of 24%.
Final thought
Conversion rate is a very useful KPI for gauging how your eCommerce website is performing in terms of UX and consumer engagement. By understanding what conversion rate percentage your webstore should be achieving for your industry or sector will give a solid foundation on which to build your CRO strategy.
Ensuring that your webstore delivers faster page load speeds, offers intuitive shopping journeys, especially at checkout, and is leveraging social proof to help increase trust in your brand and business, will help increase conversion.
To manage and measure your conversion rates CRO testing is vital. But remember, CRO testing is not a one-time thing; it’s an ongoing process that done diligently will ensure that you always have a higher converting webstore. Because of this it makes sense to partner with a CRO specialist to help you plan and implement an effective conversion optimisation strategy.
Is your eCommerce website giving consumers consistently outstanding shopping experiences? If you would like to know more about CRO, then get in touch today for a chat with one of our eCommerce development experts.


 Back
Back
